Regression fixtures#
pytest-gee fixtures that will make it easy to generate test data for your test suits using Earth
Engine server side objects as sources. It is based on the pytest-regressions plugin and add GEE
data management backend. We highly recommend users to read their documentation
to understand how to use some parameter of the fixtures like the saving directory and the management
of parametrized tests.
Note
The fixtures provided by this plugin are based on the pytest-regressions plugin and are fully
compatible with it. This means that you can use the pytest-regressions fixtures and the pytest-gee
fixtures in the same test suit.
ee_list_regression#
Suppose the output of our test is a ee.List object containing informmation. We could
test the result as follow:
def test_list():
    list = ee.List([ee.Number(0.11111111), ee.String("test")])
    assert list.getInfo()[0] == 0.11111111
    assert list.getInfo()[1] == "test"
But this presents a number of problems:
Gets old quickly.
Error-prone.
If a check fails, we don’t know what else might be wrong with the obtained data.
Does not scale for large data.
Instead, we can use the ee_list_regression fixture to save
the expected output and compare it with the obtained output in a humanly readable format:
def test_list(ee_list_regression):
    list = ee.List([ee.Number(0.11111111), ee.String("test")])
    ee_list_regression.check(list)
That will be saved in a yaml file:
# <path_to_test_folder>/<filename>/<test name>.yaml
- 0.11111111
- test
ee_dictionary_regression#
Suppose the output of our test is a ee.Dictionary object containing informmation. We could
test the result as follow:
def test_dict():
    dict = ee.Dictionary({"key1": ee.Number(0.11111111), "key2": ee.String("test")})
    assert dict.getInfo()["key1"] == 0.11111111
    assert dict.getInfo()["key2"] == "test"
But this presents a number of problems:
Gets old quickly.
Error-prone.
If a check fails, we don’t know what else might be wrong with the obtained data.
Does not scale for large data.
Instead, we can use the ee_dictionary_regression fixture
to save the expected output and compare it with the obtained output in a humanly readable format:
def test_dict(ee_dictionary_regression):
    dict = ee.Dictionary({"key1": ee.Number(0.11111111), "key2": ee.String("test")})
    ee_dictionary_regression.check(dict)
That will be saved in a yaml file:
# <path_to_test_folder>/<filename>/<test name>.yaml
key1: 0.11111111
key2: test
ee_feature_collection_regression#
Suppose the output of our test is a ee.FeatureCollection object containing informmation.
We could test the result as follow:
def test_fc():
    fc = ee.FeatureCollection([ee.Feature(ee.Geometry.Point([0, 0]), {"key1": 0.11111111, "key2": "test"})])
    assert fc.getInfo()["features"][0]["properties"]["key1"] == 0.11111111
    assert fc.getInfo()["features"][0]["properties"]["key2"] == "test"
    assert fc.getInfo()["features"][0]["geometry"]["type"] == "Point"
Instead we can use the ee_feature_collection_regression
fixture to save the expected output and compare it with the obtained output in a humanly readable format
compatible with the geo_interface standard:
def test_fc(ee_feature_collection_regression):
    fc = ee.FeatureCollection([ee.Feature(ee.Geometry.Point([0, 0]), {"key1": 0.11111111, "key2": "test"})])
    ee_feature_collection_regression.check(fc)
That will be saved in a yaml file:
# <path_to_test_folder>/<filename>/<test name>.yaml
type: FeatureCollection
features:
- type: Feature
  geometry:
    type: Point
    coordinates:
    - 0
    - 0
  properties:
    key1: 0.11111111
    key2: test
ee_image_regression#
Suppose the output of our test is a ee.Image object containing informmation. We could test the result as follow:
import ee
import pytest

def test_image():
    image = ee.Image("LANDSAT/LC08/C02/T1_L2/LC08_191031_20240607")
    image = image.normalizedDifference(["SR_B5", "SR_B4"])
    assert image.bandNames().size().getInfo() == 1
Instead we can use the ee_image_regression fixture to save the expected output and compare
it with the obtained output as a processed .png image:
import ee
import pytest

def test_image(ee_image_regression):
    image = ee.Image("LANDSAT/LC08/C02/T1_L2/LC08_191031_20240607")
    image = image.normalizedDifference(["SR_B5", "SR_B4"])
    ee_image_regression.check(image, scale=1000)
That will be saved in a png file:
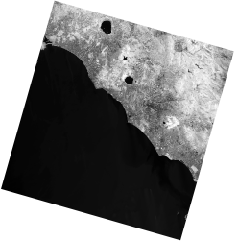
ee_image_regression comes with more extra options than the other regressions as you need to give information
about the scale, region and bands you want to see on the final output. First the image must be small as the
image is generated via the ee.Image.getThumbURL() method hat has a maximum limit of pixels.
By default the fixture will autodetect the number of bands and display either a black&white single band or a
RGB representation of the 3 first bands. You can customize the output by passing the viz_params argument to the
check() method. The viz_params argument is a dictionary that
is the same as the one used in the ee.Image.getThumbURL() method. For example to display the image in
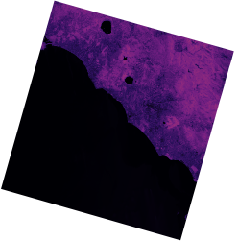
magma colormap with the value stretched to 2 standard deviation (instead of the default min-max) you can do:
import ee
import pytest

def test_image(ee_image_regression):
    image = ee.Image("LANDSAT/LC08/C02/T1_L2/LC08_191031_20240607")
    image = image.normalizedDifference(["SR_B5", "SR_B4"])
    palette = ["#000004", "#2C105C", "#711F81", "#B63679", "#EE605E", "#FDAE78", "#FCFDBF"]
    viz = {"bands": ["nd"], "min": 0.0122, "max": 1.237, "palette": palette}
    ee_image_regression.check(image, viz_params=viz, scale=1000)